Built for industrial IoT fleets

Stop paying engineers
to babysit your database.

Caterpillar's fleet generates billions of data points a day. CatWork gives you automated retention, elastic scaling, and real-time telemetry — so your engineers can build, not firefight.

$1.78M
Annual savings potential
1,000+
Engineering hours reclaimed/yr
12 sites
Global fleet coverage
0 scripts
Manual data rotation needed
The problem

Two problems costing millions a year

Manual retention scripts and over-provisioned infrastructure are draining elite engineering talent and budget.

Problem 1 — Retention
Manual data rotation every 30 days
Senior engineers spend 84 hours every month running custom roll scripts across all clusters. One failed script can crash storage before anyone notices. Critical machine history is one human error away from being lost.
$400,000/yr
2 engineers × 1,008 hrs × $200/hr
Problem 2 — Scaling
Peak-provisioned infra idle 95% of the time
Each site runs bare-metal InfluxDB v1 scaled to handle Fleet Surge Diagnostics — 48-hour bursts, 12× a year. That's 574 hours of surge out of 8,760, yet you pay for peak capacity year-round at every site.
$3.5M/yr
Current v1 infrastructure across 12 sites
The solution

Automated, elastic, built for fleets

Migrate to InfluxDB v3 with CatWork and eliminate both problems with purpose-built architecture.

Elastic query scaling
Dynamic queriers spin up for Fleet Surge Diagnostics and scale back down automatically. Pay for compute only when the surge hits.
📊
Live global dashboard
Aggregated fleet health across all 12 sites. Refreshes every 10 seconds. Alerts fire every 60 seconds for early failure detection.
🛡
Zero data loss risk
Automated retention means no human ever touches a deletion script again. Critical machine uptime history protected by policy, not process.

Live site status — all 12 regions

Toggle v1 → v3 to see the visual impact across every site. Click any site card for detail.

Caterpillar global fleet
12 active sites · mock data · refreshed every 10s
Live
Sites online
10 / 12
Degraded
2
Manual scripts/mo
24
Annual infra cost
$3.5M
Site detail
Architecture comparison
InfluxDB v1 — current
Bare-metal, no cloud scaling
Monthly manual roll scripts
No table-level retention
Peak-provisioned 100% of year
Manual DB stitching for history
InfluxDB v3 — CatWork
Cloud-native, elastic compute
Automated retention by table
Per-type TTL policies
Dynamic queriers for surge only
Unified history, no stitching
Annual cost breakdown
v1 bare-metal (current)
$3.5M
$3,500,000
v3 base infrastructure
$720k
$720,000
v3 dynamic queriers (surge only)
$1.4M
$1,400,000
Total savings with v3:$1,380,000 / yr

12 sites across 4 regions

Hover any site pin to inspect status, storage, and latency. Toggle v1 → v3 to see migration impact.

Global fleet map
Hover pins to inspect · toggle to compare versions
Live
Status:
Storage:
Latency:
Scripts/mo:
Temp:
Conditions:
Wind:
HealthyDegraded

Fleet Surge Diagnostics — annual schedule

12 surge events per year, 48 hours each. Click any month to explore the workload queue and v1 vs v3 impact.

Fleet surge diagnostic timeline
12 surge events × 48h each · click a month to explore
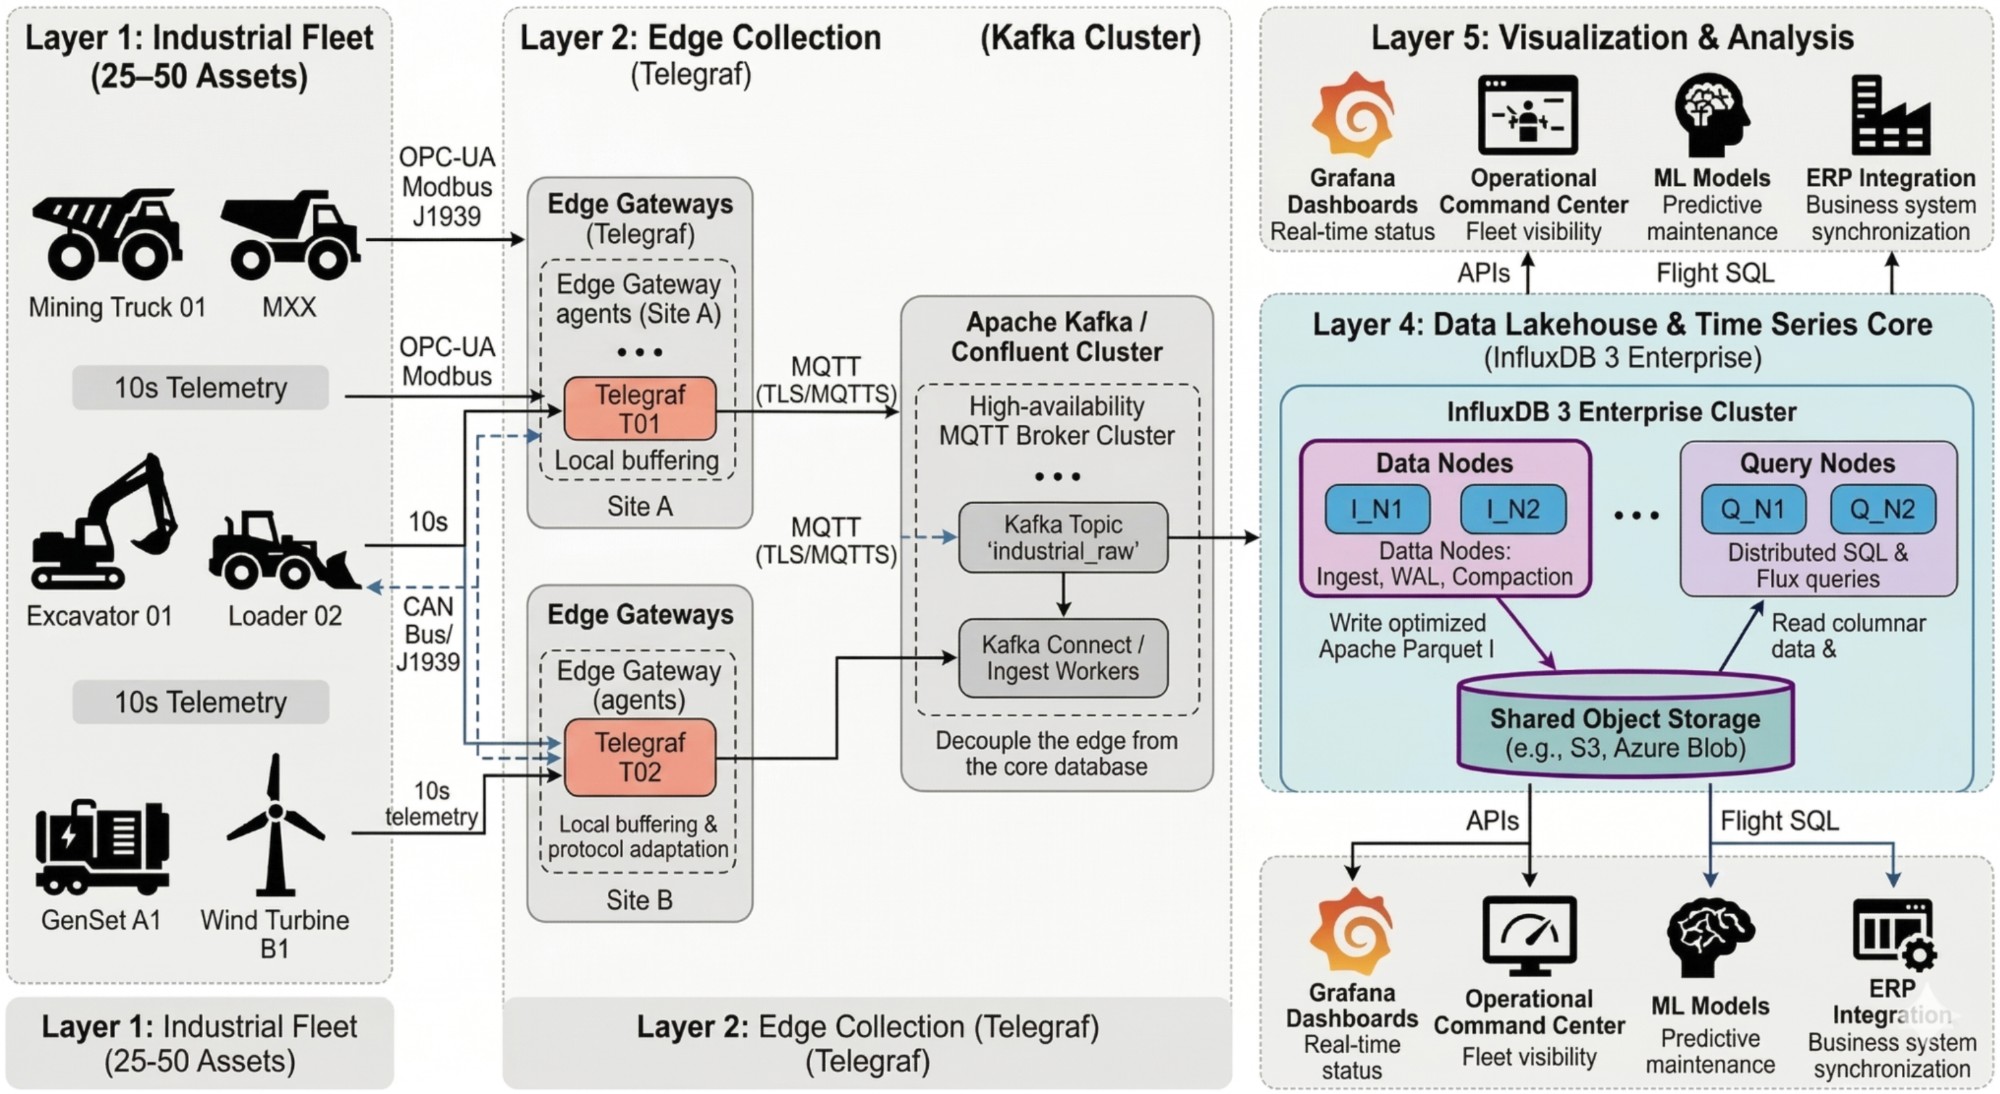
Fleet Surge Diagnostics run once per month — a 48-hour window where all 12 sites simultaneously run deep queries on the last 30 days of data, compare regional performance, and identify early component failure. Executives monitor aggregated dashboards while data scientists run ad hoc predictive maintenance queries.
Surge window
48 hours
Sites in surge
12
All regions simultaneous
Infra utilization
100%
Peak-provisioned year-round (v1)
Hours in surge/yr
574
of 8,760 total (6.5%)
Pre-surge (Day 28–29)
Scripts verified, clusters staged, queues cleared
Surge window (48h)
Deep queries, cross-region compare, exec dashboard, ad hoc ML queries
Post-surge (Day 32–33)
Reports generated, data shuffled, old DBs deleted manually (v1)
Workload priority queue during surge
Live telemetry ingestion (all 12 sites)
P0 — never blocked
cont.
Deep diagnostic queries (30-day window)
P1 — surge only
48h
Executive global dashboard aggregation
P2 — queued
48h
Cross-region performance comparison
P2 — queued
36h
Data scientist ad hoc ML queries
P3 — background
~20h
Manual data shuffle & DB rotation (v1 only)
P3 — post-surge
12h
v1 during surge
Peak compute always on $3.5M/yr
Manual queue management 84 hrs/mo
Risk of script failure High
Scale mechanism None (bare-metal)
Post-surge data shuffle Manual, 12h
v3 during surge
Elastic queriers spin up $1.4M/yr
Automated queue routing 0 hrs/mo
Risk of script failure None
Scale mechanism Dynamic queriers
Post-surge data shuffle Automated TTL

See your numbers

Adjust the sliders to model your fleet's cost and time savings.

Hours saved on manual data management
Engineers doing data rotation2
Hours per engineer per month42
Hourly rate ($)$200
Hours wasted per year1,008
Annual engineer cost$403,200
With CatWork1,008 hrs reclaimed
Infrastructure cost: v1 vs v3
Number of sites12
v1 bare-metal (current)$3,500,000/yr
v3 base infra$720,000/yr
v3 dynamic queriers$1,400,000/yr
Annual savings$1,380,000
v1 infrastructure
$3.5M
v3 total
$2.12M
Platform

Everything your fleet needs

From edge ingestion to global dashboards, built on InfluxDB v3.

📡
12-site data ingestion
Real-time and 30-day historical data from every site, unified with a plug-in emitter per cluster.
10-second dashboard refresh
Live fleet telemetry visible globally. No manual stitching of monthly databases required.
🔔
1-minute alerting
Automated alerting runs every 60 seconds to catch early signs of component failure.
🧪
Ad hoc query support
Data scientists run predictive maintenance model queries without impacting live telemetry ingestion.
🌍
Global executive view
Aggregated cross-region dashboard for leadership, with workload isolation so surge queries never throttle ops.
⚙️
Automated retention policies
Table-level TTLs replace monthly roll scripts. Short-lived telemetry and long-term reliability data coexist safely.

Ready to stop the data shuffle?

See how CatWork modernizes Caterpillar's fleet data platform — saving $1.78M a year and 1,000+ hours of engineering time.